Bennington
US Poverty Rate Census Data Shows Record Lows Amid Local Relief Strain
The official poverty rate in the United States dipped slightly by half a percentage point last year to a historic low of 10.2%, according to U.S. Census Bureau data released Tuesday. The supplemental poverty rate, a more holistic figure that…

Last updated:
Key points
- The official US poverty rate reached a historic low of 10.2 percent in 2025, while median household income climbed to $87,460.
- The supplemental poverty measure remained flat at 13.1 percent, showing persistent pressure from living costs and non-cash expenses.
- Recent federal cuts to food assistance and Medicaid could cause future poverty indicators to rise next year.
NewsWK — New federal figures show an overall decline in national hardship. However, families across Bennington County still face tight household budgets. Rising grocery bills and shifting safety net programs keep daily expenses high throughout southwestern Vermont.
Why it matters
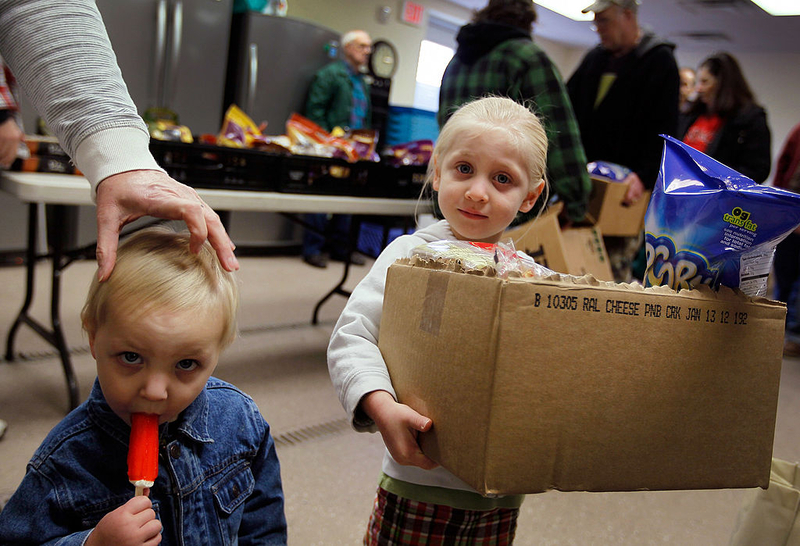
National benchmarks often mask the financial strain felt in rural working towns across our area. When federal rules shift food aid or health care funding, local food shelves must act quickly. Regional providers in Bennington work to fill the gaps. As a result, community resources face immediate pressure whenever national programs tighten.
Local families often balance seasonal wages with high heating and housing costs. Therefore, broad statistical gains do not always translate into easier balance sheets for area residents. Many neighbors in Pownal, Shaftsbury, and Manchester still struggle to keep up with basic weekly expenses.
What does the new census bureau poverty report show?
The latest census report shows the official national poverty rate fell half a percentage point to 10.2 percent in 2025. In addition, US median household income rose 2.6 percent to reach a record peak of $87,460 after inflation. Consequently, the benchmark established a record low for the official measurement, while health coverage remained flat at 92.1 percent.
However, broader metrics told a much flatter story across the country. In the prior year, the overall coverage rate stood at 92 percent. Thus, coverage moved only slightly during 2025.
Key findings from the federal economic update include:
- The official poverty rate dropped to 10.2 percent in 2025.
- US median household income rose 2.6 percent to $87,460.
- Earnings for full-time female workers increased by roughly 3 percent.
- Full-time male workers saw earnings decrease by 0.9 percent.
- Health coverage reached 92.1 percent nationwide.
What does the supplemental poverty measure census report reveal?
The supplemental poverty measure census researchers track held essentially unchanged at 13.1 percent in 2025. This alternative tally reflects non-cash assistance alongside necessary household spending. Because of these factors, the data demonstrates that everyday living costs continue to squeeze working families nationwide despite broader statistical economic gains.
Specifically, this broader metric incorporates tax policies, medical bills, and nutrition assistance. Because it factors in non-cash safety nets, analysts watch it closely. Furthermore, many economists argue that flat supplemental rates reveal persistent struggles for lower-income households.
Steven Durlauf directs the Stone Center for Research on Wealth Inequality and Mobility at the University of Chicago. He noted this clear divide in the data. “There’s some basic good news there, and that is that median household income, you know, substantially increased 2.6% after inflation is nothing to to sneeze at,” Durlauf said. Yet he warned that static supplemental numbers mean lower-wage workers might miss out on wider economic gains.
What future pressures will benefit programs face?
Federal lawmakers recently enacted sweeping budget adjustments that reduced funding for Medicaid and the Supplemental Nutrition Assistance Program. Because these changes took effect after the 2025 survey period, official tallies do not yet capture their full community impact. However, researchers expect these policy shifts to intensify financial hardship for millions of vulnerable families nationwide.
Meanwhile, researchers already observe early shifts in program participation nationwide. For example, child enrollment in food assistance fell by 1.2 million between July 2025 and July 2026. Furthermore, nonpartisan projections from the Congressional Budget Office estimate that about 15 million Americans could lose health insurance over the coming decade.
In response, Durlauf cautioned that price pressures and benefit reductions will weigh heavily on vulnerable populations. “The main issue for most individuals is going to be the fact that prices and inflation is outstripping wage growth, and so that’s obviously some diminution of real incomes for some people,” Durlauf said.
How will these economic shifts affect Southern Vermont?
Community pantries and regional social service agencies throughout Bennington County often see higher demand whenever federal aid programs contract. Even as overall US poverty rate census data points toward record progress, local organizers anticipate steady community needs. Therefore, area providers must prepare for sustained pressure as federal safety nets shrink.
Towns across Bennington and nearby Berkshire and Rensselaer counties rely heavily on stable benefit networks. Consequently, local leaders monitor federal shifts closely. Next year’s federal report will offer the first comprehensive look at these policy shifts. It will show how recent federal benefit reductions affect rural households over the long haul.
This article was produced with the assistance of AI and reviewed by our editorial team.
Sources
Related: Border County Tax Pressures Mount as New York Shifts SNAP Costs
Related: National Violent Crime Fell at Record Pace in 2025, FBI Reports
See a typo? Report it here.